Interactive visualisation of gene expression time-course data (click 'play' or select different displays using the plot tabs). This example shows the relationship between expression of the ERG gene-fusion and the HES1 gene in VCaP prostate cancer cells treated with androgens or vehicle control over a 24hr period (data from Massie et al. ERC 2015, plots generated using R and GoogleVis).
References
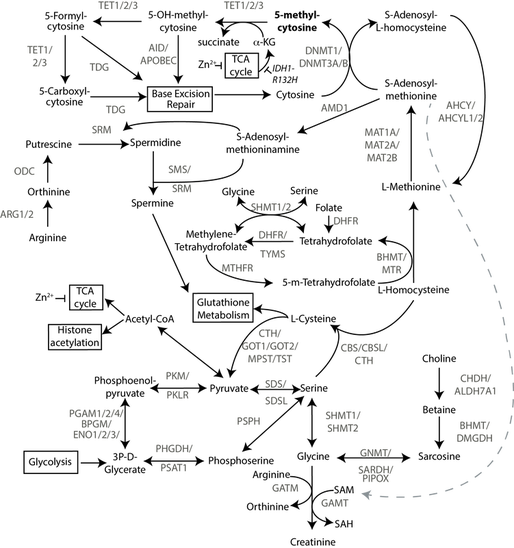
Massie CE, Mills IG, Lynch AG. The importance of DNA methylation in prostate cancer development. The Journal of Steroid Biochemistry and Molecular Biology. 2017 Feb 1;166:1-5. https://doi.org/10.1016/j.jsbmb.2016.04.009
Massie CE, Lynch A, Ramos‐Montoya A, Boren J, Stark R, Fazli L, Warren A, Scott H, Madhu B, Sharma N, Bon H. The androgen receptor fuels prostate cancer by regulating central metabolism and biosynthesis. The EMBO Journal. 2011 Jul 6;30(13):2719-33. https://doi.org/10.1038/emboj.2011.158
Sharma NL, Massie CE, Ramos-Montoya A, Zecchini V, Scott HE, Lamb AD, MacArthur S, Stark R, Warren AY, Mills IG, Neal DE. The androgen receptor induces a distinct transcriptional program in castration-resistant prostate cancer in man. Cancer Cell. 2013 Jan 14;23(1):35-47. https://doi.org/10.1038/emboj.2011.158
Asim M, Massie CE, Orafidiya F, Pértega-Gomes N, Warren AY, Esmaeili M, Selth LA, Zecchini HI, Luko K, Qureshi A, Baridi A. Choline kinase alpha as an androgen receptor chaperone and prostate cancer therapeutic target. Journal of the National Cancer Institute. 2016 May 1;108(5):djv371. https://doi.org/10.1093/jnci/djv371
Pertega-Gomes N, Vizcaino JR, Felisbino S, Warren AY, Shaw G, Kay J, Whitaker H, Lynch AG, Fryer L, Neal DE, Massie CE. Epigenetic and oncogenic regulation of SLC16A7 (MCT2) results in protein over-expression, impacting on signalling and cellular phenotypes in prostate cancer. Oncotarget. 2015 Aug 8;6(25):21675. https://doi.org/10.18632%2Foncotarget.4328